Our state-of-the-art vision model, born from the ECMWF Code 4 Earth program, is now available on Hugging Face. Say goodbye to the limitations of low-resolution reanalysis datasets - ConvSwin2SR enables quick and cost-effective access to high-resolution insights over the Mediterranean region that could be used for mitigation and adaptation policies. Allow us to guide you through this new tool.
In short, we have trained a meteorological downscaling transformer for the state-of-the-art (SOTA) reanalysis dataset, ERA5, over the Mediterranean area. We named it ConvSwin2SR and the model is now open on Hugging Face.
Besides, as part of our commitment to the open community, we are presenting the model ConvSwin2SR, a SOTA vision model developed during ECMWF Code 4 Earth programme by a team of researchers from our institution and the Cantabria Institute of Physics in collaboration with ECMWF.
The motivation behind ConvSwin2SR is simple - Deep Learning (DL) models that can be run quickly (at a fraction of the cost of running a regional reanalysis) are needed to reduce the cost of accessing high-resolution reanalysis datasets almost directly. Currently, ECMWF offers the ERA5 near-live dataset, but its resolution may be low for many of its use. Therefore, government agencies, businesses, and organisations may benefit from ConvSwin2SR to make better-informed decisions related to agriculture, energy, disaster & water resource management, public health and more.
In addition, the ConvSwin2SR model may be used with climate projections to produce high-resolution data that can be used for climate adaptation and mitigation strategies.
Reanalysis Downscaling
The problem addressed here is known as super resolution in the computer vision field, but in climate science, it is more accurately referred to as downscaling. The downscaling techniques are grouped as follows:
- Dynamical downscaling: by using numerical climate models -often called regional climate models- which are coupled to the boundary conditions provided by lower resolution global climate models.
- Statistical downscaling: It represents the use of statistical techniques to find relationships between large-scale climate variables and small-scale conditions. This approach is closely related to the concept of super-resolution in computer vision.
Our work consists of exploring the SOTA techniques in the field of computer vision in their application to statistical downscaling of European reanalysis.
On the one hand, ERA5 will be considered as an input dataset. ERA5 is the fifth generation ECMWF reanalysis which provides climate and weather information from 1940 up to the present. ERA5 simulations are published by the Copernicus Climate Change Service (C3S) with a 5-day delay.
C3S defines reanalysis as a scientific method which aims to estimate weather conditions for each day over a period as accurately as possible. It is based on a multitude of existing past weather observations from all around the globe and at different points in time, integrated into a current weather computer model. The reanalysis outputs are a so-called gridded product. In ERA5, the spatial resolution is about 30x30km which means that any single point value is a representation of the combined environment of all atmosphere states within that 30x30 km area.
On the other hand, CERRA is a limited-area reanalysis covering Europe with a higher spatial resolution, 5.5 km, and it is forced by ERA5. CERRA is based on the HARMONIE-ALADIN data assimilation and is also published by C3S. CERRA covers the period from 1984 up to 2021, so it is not continuously updated at the moment.
ConvSwin2SR will be trained to take ERA5 temperature as input data while its corresponding CERRA field will be used as target. ConvSwin2SR intends to emulate the CERRA regional reanalysis and enables having a continuously updated 5-km temperature field.
Data sources
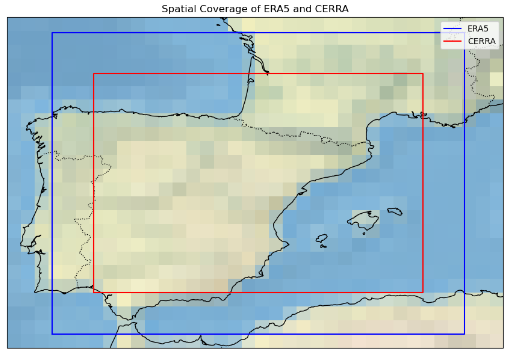
This project has used the two European reanalyses, ERA5 and CERRA, to design, train and validate statistical downscaling models with SOTA DL techniques, as vision transformers or diffusion models. The models take ERA5 fields as input and try to produce CERRA-like fields. We have chosen a fixed Mediterranean region, shown in Figure 1. The selected domain encompasses a wide range of ecosystems, including mountains, lakes, seas, islands, rivers, and more, covering a vast and diverse area.
ERA5
As per C3S definition, "ERA5 is the fifth generation ECMWF reanalysis for the global climate and weather" from 1940 to the present day. "ERA5 provides hourly estimates for a large number of atmospheric, ocean-wave and land-surface quantities. An uncertainty estimate is sampled by an underlying 10-member ensemble at three-hourly intervals. Ensemble mean and spread have been pre-computed for convenience. Such uncertainty estimates are closely related to the information content of the available observing system which has evolved considerably over time. They also indicate flow-dependent sensitive areas. To facilitate many climate applications, monthly-mean averages have been pre-calculated too, though monthly means are not available for the ensemble mean and spread", C3S explained.
The input grids are structured as 4D tensors with shapes: (batch size, 1, 60, 44)
...where 60 and 44 are the number of grid points along the longitude and latitude axes, respectively. Geographically, the ERA5 data covers a region extending from a westernmost point at longitude -8.35 to an easternmost point at longitude 6.6, and from a northernmost point at latitude 46.45 to a southernmost point at latitude 35.50.
CERRA
The CERRA system is based on the HARMONIE-ALADIN data assimilation system which has been developed and used within the ACCORD consortium. It is implemented and optimised for the entire European area with surrounding sea areas with a horizontal resolution of 5.5 km and 106 vertical levels. The system uses lateral boundaries conditions obtained from the ERA5 global reanalysis. Also, the large scales in the regional system are constrained by data from the global reanalysis.
They are represented as 4D tensors with larger dimensions of: (batch size, 1, 240, 160)
...indicating a finer grid resolution compared to the input grids. Here, 240 and 160 are the number of grid points along the longitude and latitude axes, respectively. The geographical coverage for these high-resolution grids extends from a westernmost point at longitude -6.85 to an easternmost point at longitude 5.1, and from a northernmost point at latitude 44.95 to a southernmost point at latitude 37.
Data Processing
The preprocessing of climate datasets ERA5 and CERRA, extracted from the Climate Data Store, is a critical step before their utilisation in training models. This section defines the preprocessing steps undertaken to homogenise these datasets into a common format. The steps include unit standardisation, coordinate system rectification, and grid interpolation.
The methodology employed in each step is discussed comprehensively in the following paragraphs:
- Unit Standardisation: A preliminary step in the preprocessing pipeline involved the standardisation of units across both datasets. This was imperative to ensure a uniform unit system, facilitating a seamless integration of the datasets in later stages.
- Coordinate System Rectification: The coordinate system of the datasets was rectified to ensure a coherent representation of geographical information. Specifically, the coordinates and dimensions were renamed to a standardised format with longitude (lon) and latitude (lat) as designated names. The longitude values were adjusted to range from -180 to 180 instead of the initial 0 to 360 range, while latitude values were ordered in ascending order, thereby aligning with conventional geographical coordinate systems.
- Grid Interpolation: The ERA5 dataset is structured on a regular grid with a spatial resolution of 0.25°, whereas the CERRA dataset inhabits a curvilinear grid with a Lambert Conformal projection of higher spatial resolution (0.05º). To overcome this disparity in the grid system, a grid interpolation procedure is performed. This step is crucial in order to align the datasets onto a common format, a regular grid (with different spatial resolutions), thereby ensuring consistency in spatial representation. The interpolation transformed the CERRA dataset to match the regular grid structure of the ERA5 dataset, keeping its initial spatial resolution of 0.05° (5.5 km).
Normalisation schema
All of the following normalisation techniques have been explored during and after ECMWF Code 4 Earth.
With historical climatologies
This consists of computing the historical climatologies during the training period for each region (pixel or domain), and normalising with respect to that. In our case, the monthly climatologies are considered, but it could also be disaggregated by the time of the day, for example.
- Pixel-wise: In this case, the climatology is computed for each pixel of the meteorological field. Then, each pixel is standardised with its own climatology statistics.
- Domain-wise: Here, the climatology statistics are computed for the whole domain of interest. After computing the statistics, two normalising schemas are possible:
- Independent: it refers to normalising ERA5 and CERRA independently, each with its own statistics.
- Dependent: it refers to using only the climatology statistics from ERA5 to standardise both ERA5 and CERRA simultaneously.
The dependent approach is not feasible for the pixel-wise schema, because there is no direct correspondence between the input and output patch pixels.
Without past information
This corresponds to normalising each sample independently by the mean and standard deviation of the ERA5 field. This is known in the ML community as instance normalisation. Here, we have to use only the distribution statistics from the inputs as the outputs will not be available during inference, but two different variations are possible in our use case:
- Using ERA5 statistics, bearing in mind it covers a wider area than CERRA.
- Using bicubic downscaled ERA5 statistics, which represents the same area as CERRA.
The difference between these two approaches is that the input patch encompasses a larger area, and therefore a more different distribution. Thus, the second approach seems to be more correct as the downscaled area distribution would be more similar to the output distribution.
Methods
Several statistical downscaling approaches were explored during ECMWF Code 4 Earth. On this post, we focus on vision transformers, but we also implemented diffusion models, U-Nets and standard interpolation techniques.
Model architecture
Our model's design is deeply rooted in the Swin v2 architecture, specifically tailored for Super Resolution (SR) tasks. The transformers library is used to simplify the model design.
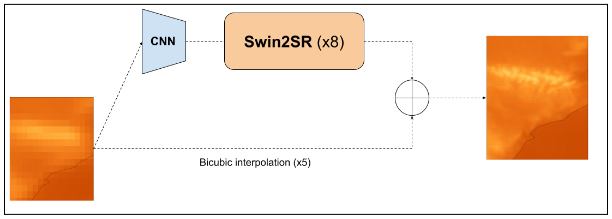
The transformers.Swin2SRModel is central to our model. This component upsamples the spatial resolution of its inputs by a factor of 8.
As Swin2SRModel only supports upscaling ratios that are powers of 2, and the real upscale ratio is ~5, a Convolutional Neural Network is included as a preprocessing module. This module converts the inputs into a (20, 30) feature map that can be fed to the Swin2SRModel to match the output shape of the region (160, 240).
The underlying objective of ConvSwin2SR is to learn the residuals stemming from bicubic interpolation over ERA5.
Model size
The specific parameters of this network are available in config.json, corresponding to DL of 12,383,377 parameters. Though lighter model architectures ranging from 100,000 of parameters to 120M are used, the best result in terms of validation loss values corresponds to the architecture presented, with 6 blocks of depth 6 with 6 heads each. The dimension of the embedding layers at each block is 180. Besides that, the patch size is fixed to 1 single pixel and the window size is set to a common divisor of both input dimension’s length – 5 in this case.
Loss function
The ConvSwin2SR model optimises its parameters using a composite loss function that aggregates multiple L1 loss terms to enhance its predictive accuracy and robustness:
- Primary Predictions Loss: This term computes the L1 loss between the primary model predictions and the reference values. It ensures that the transformer's outputs closely match the ground truth.
- Downsampled Predictions Loss: This term calculates the L1 loss between the downsampled versions of the predictions and the reference values. By incorporating this term, the model is incentivised to preserve the underlying relations between both spatial resolutions. The references and predictions are upscaled by average pooling by a factor of x5 to match the source resolution. Although this loss term could be (technically) computed with respect to the low-resolution sample, the upscaled reference values are considered, due to the fact that the average pooling used for upscaling does not represent the true relationship between both datasets considered.
- Blurred Predictions Loss: To ensure the model's robustness against small perturbations and noise, this term evaluates the L1 loss between blurred versions of the predictions and the references. This encourages the model to produce predictions that maintain accuracy even under slight modifications in the data representation. On the other hand, it can smooth the prediction field too much, so its use should be carefully studied before including it in your model. To produce the blurred values, a gaussian kernel of size 5 is applied.
Training details
The ConvSwin2SR model is trained over 100 epochs, clocking in at 3,648 days with a batch size of 2 accumulating the gradients for 4 batches before updating the model weights. The Adam optimizer uses a learning rate starting at 0.0001 and decreasing following the values of the cosine function. Besides, the optimizer’s learning rate has a warm-up phase of 500 steps in which the learning rate increases linearly from 0 to 0.0001. The aim of the warm-up is to prevent model gradients from exploding in the first steps of the training phase, but letting the model converge faster when the training is stabilised.
The dataset's temporal division is structured to optimise model training and subsequent per-epoch validation. The training duration spans 29 years, commencing in January 1985 and culminating in December 2013. Sequentially, the validation phase begins, covering the period from January 2014 to December 2017. This 4-year interval is solely dedicated to evaluating the model's aptitude on data it hasn't been exposed to during training. This separation ensures the model's robustness and its capability to make robust predictions.
Apart from the loss terms, some metrics of interest are computed during the training procedure such as: the rate of improvement with respect to the baseline method -the bicubic interpolation-, and the relative bias or the variance ratio between the predictions and the reference values. A TensorBoard dashboard is deployed directly on Hugging Face, with the loss and metric values in both training and validation datasets over the 100 epochs.
The ConvSwin2SR model demonstrates a commendable inference speed. Specifically, when tasked with downscaling 248 samples, which equals an entire month of ERA5 samples at 3-hour intervals, the model completes the operation in 21 seconds. This level of efficiency is observed in a local computing environment outfitted with 16GB of RAM and 4GB of GPU memory.
Results
Testing dataset
The testing data samples correspond to the three-year period from 2018 to 2020. This segment is crucial for assessing the model's real-world applicability and its performance on the most recent data points, ensuring its relevance and reliability in current and future scenarios.
Model Evaluation
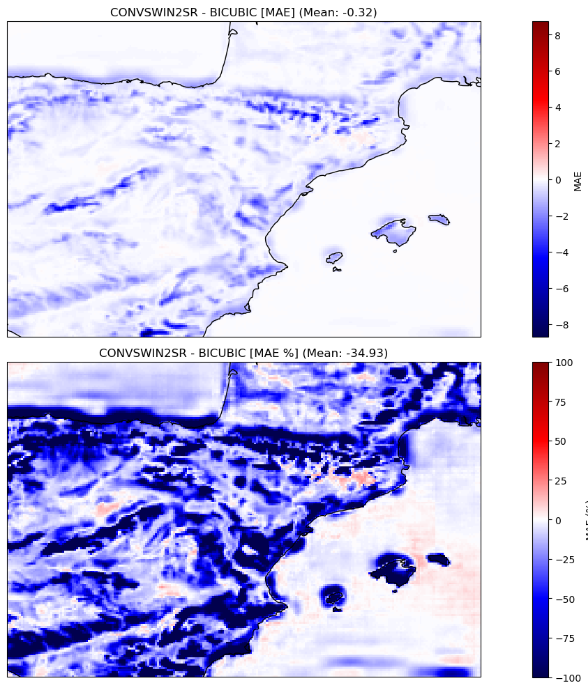
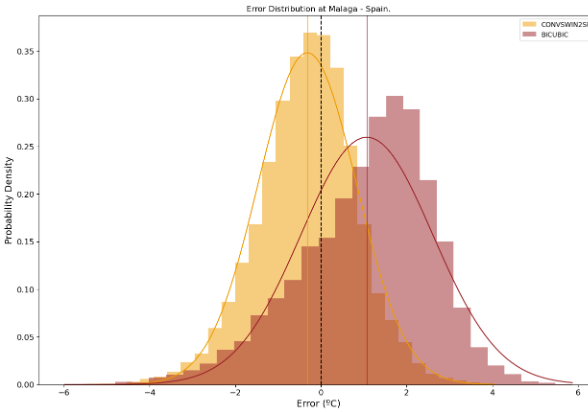
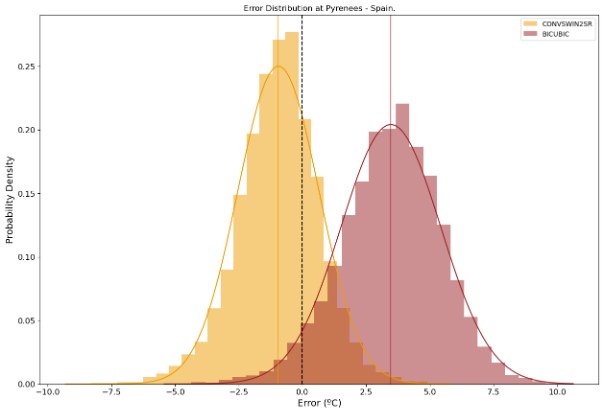
In our evaluation, the proposed model displayed a significant enhancement over the established baseline, which employs bicubic interpolation for the same task. Specifically, our model achieved a noteworthy 34.93% reduction in Mean Absolute Error (MAE), a metric indicative of the average magnitude of errors between predicted and actual values (see Figure 3), which corresponds to a reduction of 0.32°C with respect to the MAE baseline. Furthermore, there was a near 30% improvement in the Root Mean Square Error (RMSE). Similar spatial patterns are shown in both metrics, where the larger improvement corresponds to mountainous areas as well as the coastline.
ConvSwin2SR’s results not only underscore its capability for better predictions, but also emphasise incredible results in locations of interest, due to their difficulty, such as coastal areas, mountainous areas or islands (see Figures 4 and 5)
Computation resources
Leveraging GPUs in deep learning initiatives greatly amplifies the pace of model training and inference. This computational edge not only diminishes the total computational duration but also equips us to proficiently navigate complex tasks and extensive datasets.
Resource providers
Our profound gratitude extends to our collaborative partners, whose invaluable contribution and support have been key to the fruition of this project. Their substantial inputs have immensely propelled our research and developmental strides.
AI4EOSC
- AI4EOSC stands for "Artificial Intelligence for the European Open Science Cloud." The European Open Science Cloud (EOSC) is a European Union initiative that aims to create a federated environment of research data and services. AI4EOSC is a specific project or initiative within the EOSC framework that focuses on the integration and application of artificial intelligence technologies in the context of open science. ConvSwin2SR will shortly feature in the AI4EOSC marketplace.
- European Weather Cloud: The European Weather Cloud is the cloud-based collaboration platform for meteorological application development and operations in Europe. Services provided range from delivery of weather forecast data and products to the provision of computing and storage resources, support and expert advice.
Hardware
For our project, we have deployed two virtual machines (VM), each featuring a dedicated GPU. One VM is equipped with a 16GB GPU, while the other boasts a more substantial 20GB GPU. This resource configuration allows us to efficiently manage a wide range of computing tasks, from data processing to model training and sampling, and ultimately drives the successful execution of our project.
It is not only a matter of having an efficient operational model faster – the main advantage is to test our solutions quickly. Therefore to have the possibility to make mistakes at an earlier stage and obtain better operational models.
Software
The code used to download and prepare the data, and train and evaluate this model is freely available through the GitHub Repository ECMWFCode4Earth/DeepR hosted by the ECMWF Code 4 Earth organisation.
More info
- Conde, M. V., Choi, U. J., Burchi, M., & Timofte, R. (2022, October). Swin2SR: Swinv2 transformer for compressed image super-resolution and restoration. In European Conference on Computer Vision (pp. 669-687). Cham: Springer Nature Switzerland.
- Hersbach, H, Bell, B, Berrisford, P, et al. The ERA5 global reanalysis. Q J R Meteorol Soc. 2020; 146: 1999–2049. https://doi.org/10.1002/qj.3803.
- Kingma, D. P., & Ba, J. (2014). Adam: A method for stochastic optimization. arXiv preprint arXiv:1412.6980.
- Liu, Z., Hu, H., Lin, Y., Yao, Z., Xie, Z., Wei, Y.,... & Guo, B. (2022). Swin transformer v2: Scaling up capacity and resolution. In Proceedings of the IEEE/CVF conference on computer vision and pattern recognition (pp. 12009-12019).
- Wolf, T., Debut, L., Sanh, V., Chaumond, J., Delangue, C., Moi, A.,... & Rush, A. M. (2020, October). Transformers: State-of-the-art natural language processing. In Proceedings of the 2020 conference on empirical methods in natural language processing: system demonstrations (pp. 38-45).
Should you want to know more about it, don't hesitate to reach out to us at predictia@predictia.es